Operations Overview
This section covers deploying, monitoring, securing, and governing JD.AI in production environments. Whether you are running a single-instance developer setup or a multi-team enterprise deployment, these guides provide the operational knowledge you need.
What's covered
Service Deployment
Install and run JD.AI Gateway as a system service. Covers Windows Service installation, Linux systemd configuration, Docker container deployment, reverse proxy setup, auto-update management, and daemon CLI commands.
Kubernetes Deployment
Deploy JD.AI to Kubernetes with Helm. Covers GHCR images, values-driven configuration, startup/readiness/liveness probes, autoscaling (HPA), PodDisruptionBudget, ingress, and service mesh annotations.
Observability
Monitor JD.AI with OpenTelemetry distributed tracing and metrics. Covers ActivitySource and Meter instrumentation, health check endpoints, Kubernetes probe configuration, Prometheus and Grafana integration, the /doctor diagnostic command, and log configuration.
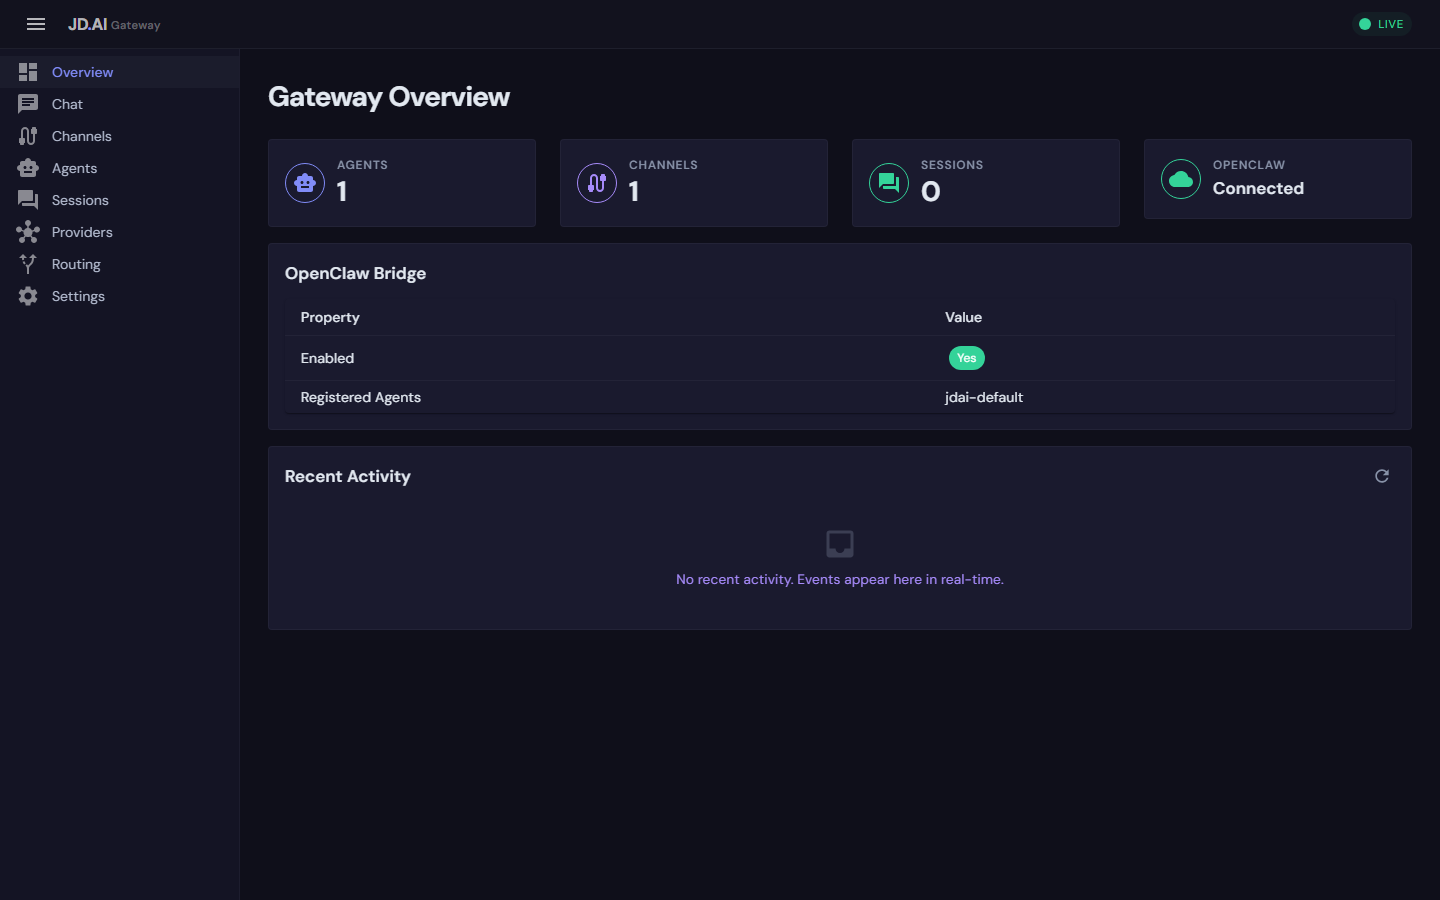
Admin Dashboard
Manage the gateway through the Blazor WebAssembly dashboard. Covers accessing the UI, real-time session monitoring, agent lifecycle management, channel status, provider configuration, and dashboard authentication.
Security & Credentials
Secure your JD.AI deployment end-to-end. Covers encrypted credential storage (DPAPI/AES), API key management, session data security, MCP server policies, local model file controls, gateway authentication, network security, and audit logging.
Enterprise Governance
Govern JD.AI usage across teams and projects. Covers token consumption tracking, budget limits, policy enforcement (tool allowlists, approved providers, model restrictions), shared workflow management, compliance and audit trails, and multi-tenant workspace isolation.
Gateway Administration
Administer the JD.AI Gateway at scale. Covers configuration management with hot reload, horizontal scaling and load balancing, channel and agent pool management, SignalR hub diagnostics, and backup and disaster recovery procedures.
Architecture overview
┌──────────────┐   ┌──────────────┐   ┌──────────────┐
│   Channels   │   │   Dashboard  │   │  REST / gRPC  │
│ (Discord,    │   │  (Blazor     │   │   Clients     │
│  Slack, etc.)│   │   WASM)      │   │               │
└──────┬───────┘   └──────┬───────┘   └──────┬───────┘
       │                  │                   │
       └──────────┬───────┴───────────────────┘
                  ▼
       ┌─────────────────────┐
       │    JD.AI Gateway    │  ← Service Deployment
       │  (ASP.NET Core)     │  ← Observability (OTel)
       │                     │  ← Security (Auth, TLS)
       ├─────────────────────┤
       │  Agent Pool Service │  ← Governance (Limits)
       │  Provider Registry  │
       │  Session Store      │
       └─────────┬──────────┘
                 │
       ┌─────────▼──────────┐
       │   AI Providers      │
       │ (Claude, Copilot,   │
       │  Ollama, Local...)  │
       └────────────────────┘
Prerequisites
- .NET 10.0 SDK or Runtime — required for all deployment modes
jdai-daemontool — for service installation (dotnet tool install -g JD.AI.Daemon)- At least one AI provider — see Providers for setup
Quick health check
Verify a running gateway is healthy:
# Full health report
curl http://localhost:18789/health

# Readiness probe (returns 503 when unhealthy)
curl -f http://localhost:18789/health/ready

# Run in-channel diagnostics
/doctor
Key directories
| Path | Purpose |
|---|---|
~/.jdai/config.json |
Global default provider and model |
~/.jdai/sessions.db |
SQLite session database |
~/.jdai/credentials/ |
Encrypted credential store |
~/.jdai/models/ |
Local GGUF models and registry |
~/.jdai/exports/ |
Exported session JSON files |
/etc/systemd/system/jdai-daemon.service |
Linux systemd unit (after install) |
Next steps
- New to JD.AI? Start with Service Deployment to get the gateway running.
- Already deployed? Set up Observability to monitor your instance.
- Running in production? Review Security and Governance.
- Managing teams? See Enterprise Governance for usage tracking and policy enforcement.